Sydney-Based Boutique Marketing Agency KPI Dashboard Case Study: 3 Strategic Recovery Insights | OuterRim Ops & Analytics
A boutique marketing agency can look commercially active while still losing control beneath the surface.
Revenue may still come in. New clients may still be signed. Campaigns may still be delivered every month. But if retention is falling, churn is rising, margins are weakening, and client satisfaction is declining, the business is no longer scaling from a healthy base.
This Sydney-Based Boutique Marketing Agency KPI Dashboard Case Study shows how structured KPI dashboards can reveal the deeper operating issues behind agency performance. Across three dashboard pages, the analysis reviews executive KPIs, financial and growth trends, client health, and a 12-month recovery roadmap.
For OuterRim Ops & Analytics, the goal is not just to build dashboards. The goal is to help growth-stage SMBs turn scattered reporting into clearer performance visibility, stronger operating control, and better leadership decisions
Confidentiality & Source Note
This case study is anonymized and does not disclose confidential client information.
The agency is presented only as a Sydney-based boutique marketing agency. Client names, identifying details, internal records, and commercially sensitive information have been intentionally withheld.
This report is based on KPI dashboard interpretation and business performance analysis. The purpose is to demonstrate how a structured dashboard can help leadership identify operational risks, diagnose performance breakdowns, and build a practical recovery plan
Executive Summary
This Sydney-Based Boutique Marketing Agency KPI Dashboard Case Study shows how structured KPI dashboards can reveal the deeper operating issues behind agency performance.
The agency generated 3.3M in total revenue and 654K in total profit over the 12 months. However, the deeper story is more concerning. Average profit margin sits at 16.67%, average retention is 55.67%, average churn is 30.83%, and average CSAT is 6.62.
The trend data shows declining retention, rising churn, falling LTV, increasing CAC, weakening ROAS, and deteriorating customer satisfaction.
This is not simply a marketing execution issue. It is an operating system issue. The business needs stronger onboarding, clearer sales-to-delivery handoff, better account management, improved reporting discipline, stronger scope control, and a more consistent KPI governance rhythm.
The dashboard turns that problem into a clear management view
Dashboard Page 1: Executive KPI Performance Overview
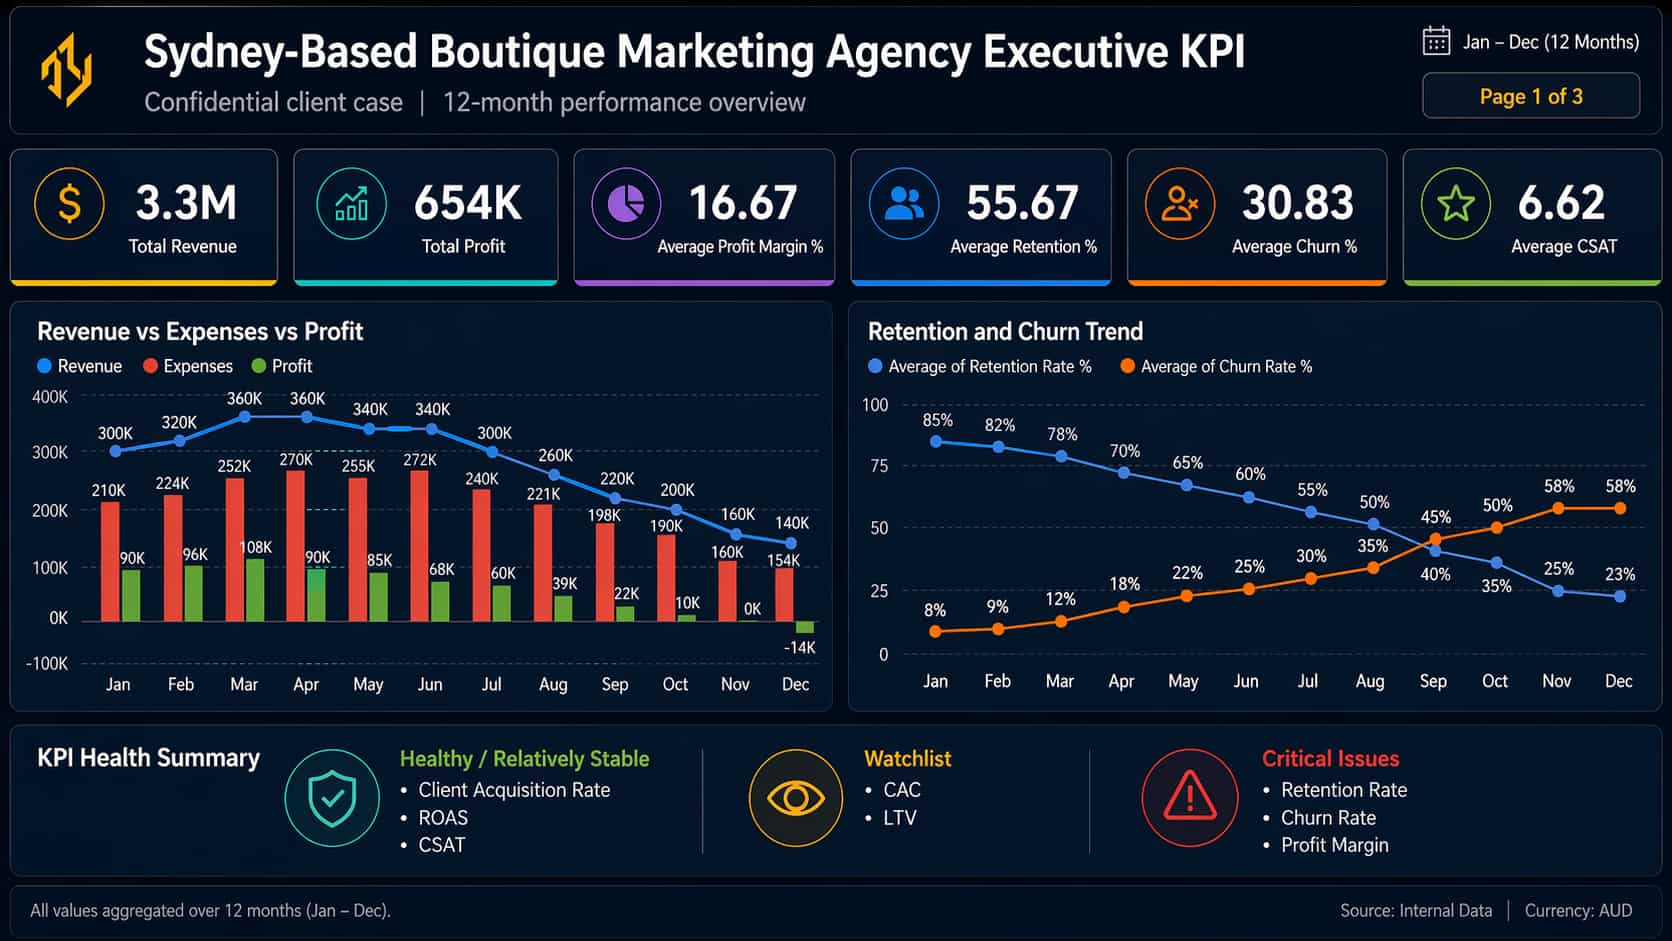
The first dashboard page provides the executive KPI overview.
At first glance, the agency still appears commercially active. Total revenue reached 3.3M, and total profit reached 654K. These numbers show that the business had demand and continued to generate revenue throughout the year.
However, the performance trend tells a weaker story.
The revenue, expenses, and profit chart shows revenue declining from its stronger early-year levels toward the end of the period. Profit also weakens significantly, with December turning negative. This matters because a boutique agency usually has less margin for operational waste than a larger firm.
The retention and churn chart is the clearest warning signal. Retention falls from 85% in January to 23% by December, while churn rises from 8% to 58%. This is not a small service issue. It signals a major breakdown in client continuity and account health.
The KPI Health Summary correctly separates the agency’s position into three categories. Client acquisition rate, ROAS, and CSAT are shown as relatively stable or healthier areas. CAC and LTV are watchlist items. Retention rate, churn rate, and profit margin are critical issues.
This page gives leadership a direct view of where the business is losing strength. It shows that the agency’s biggest risk is not demand generation alone. The bigger risk is the loss of client value after acquisition.
Dashboard Page 2: Financial & Growth Analysis
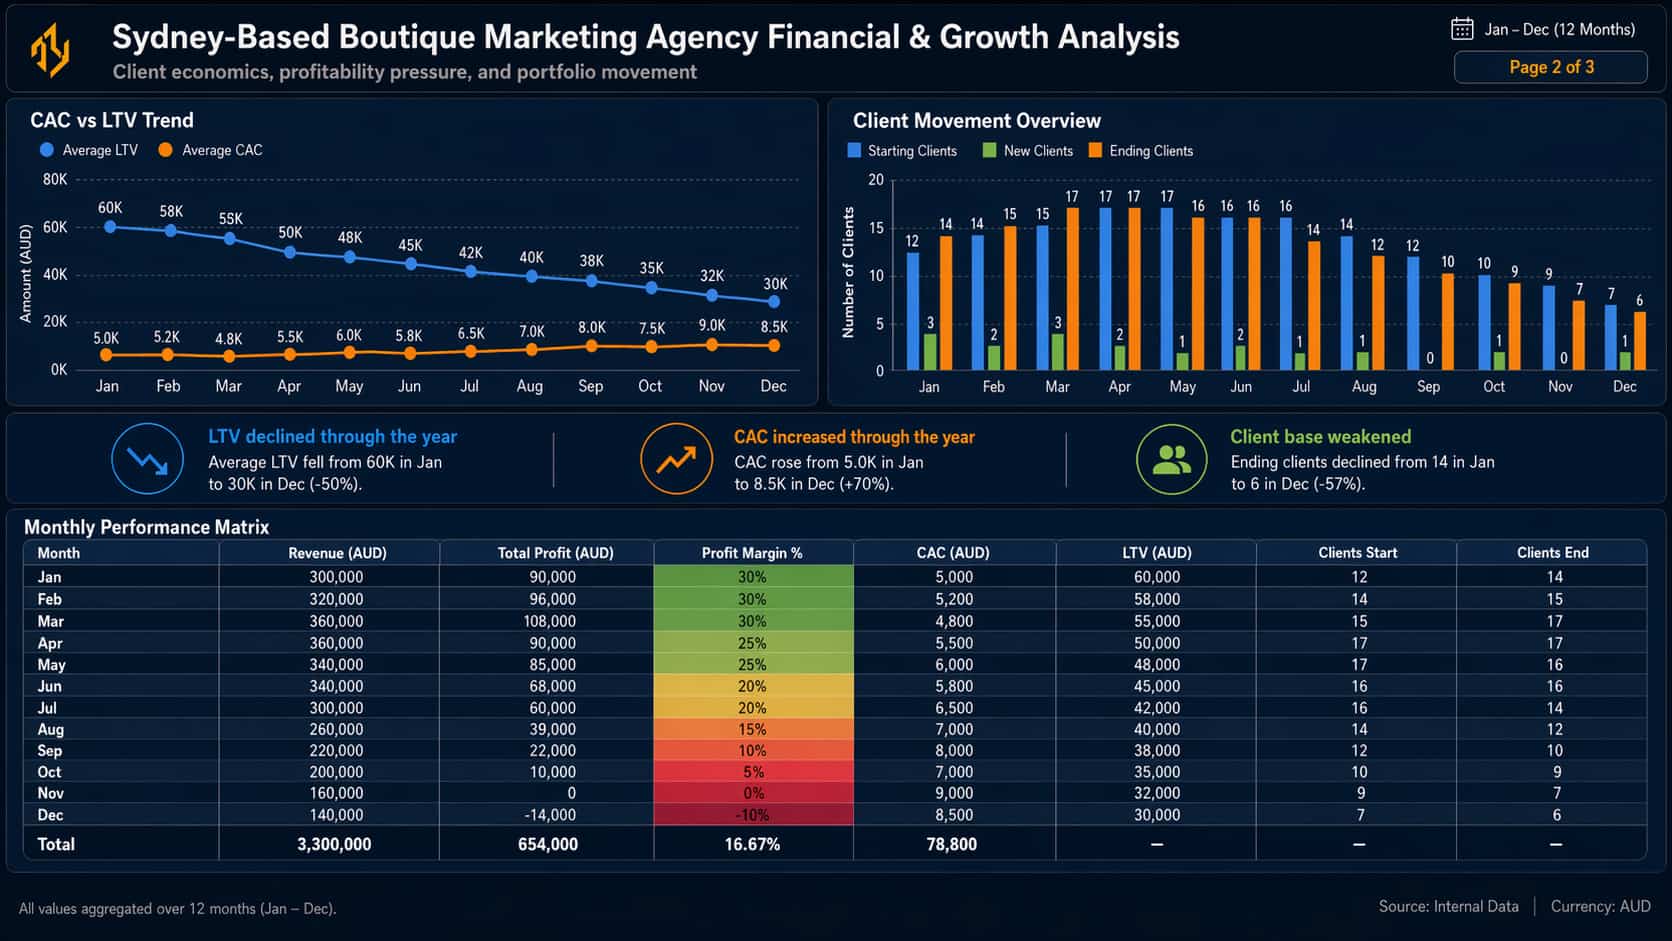
The second dashboard page diagnoses the agency’s financial and growth pressure.
The CAC vs LTV trend is especially important. LTV declines from 60K in January to 30K in December. At the same time, CAC rises from 5.0K to 8.5K. This means the agency is spending more to acquire clients while each client is becoming less valuable over time.
That is a dangerous combination.
For additional context, businesses often compare Customer Acquisition Cost and Lifetime Value Economics when assessing whether growth is becoming more or less efficient. In this case, the dashboard suggests that client economics are moving in the wrong direction.
The client movement overview supports the same conclusion. The year-end client base declines from 14 clients in January to 6 clients in December. New clients still appear throughout the year, but not enough to offset the weakening client base.
This is where a KPI dashboard becomes more than a reporting tool. It shows leadership the relationship between acquisition, retention, profitability, and client base health.
If LTV falls while CAC rises, the agency cannot simply “sell harder” out of the problem. It must improve retention, delivery quality, account management, and margin discipline.
The monthly performance matrix adds more detail. Revenue declines from 300K in January to 140K in December. Profit falls from 90K to -14K. Profit margin drops from 30% to -10%.
The issue is not only growth. It is the quality and sustainability of that growth.
Dashboard Page 3: Client Health and OuterRim Recovery Roadmap
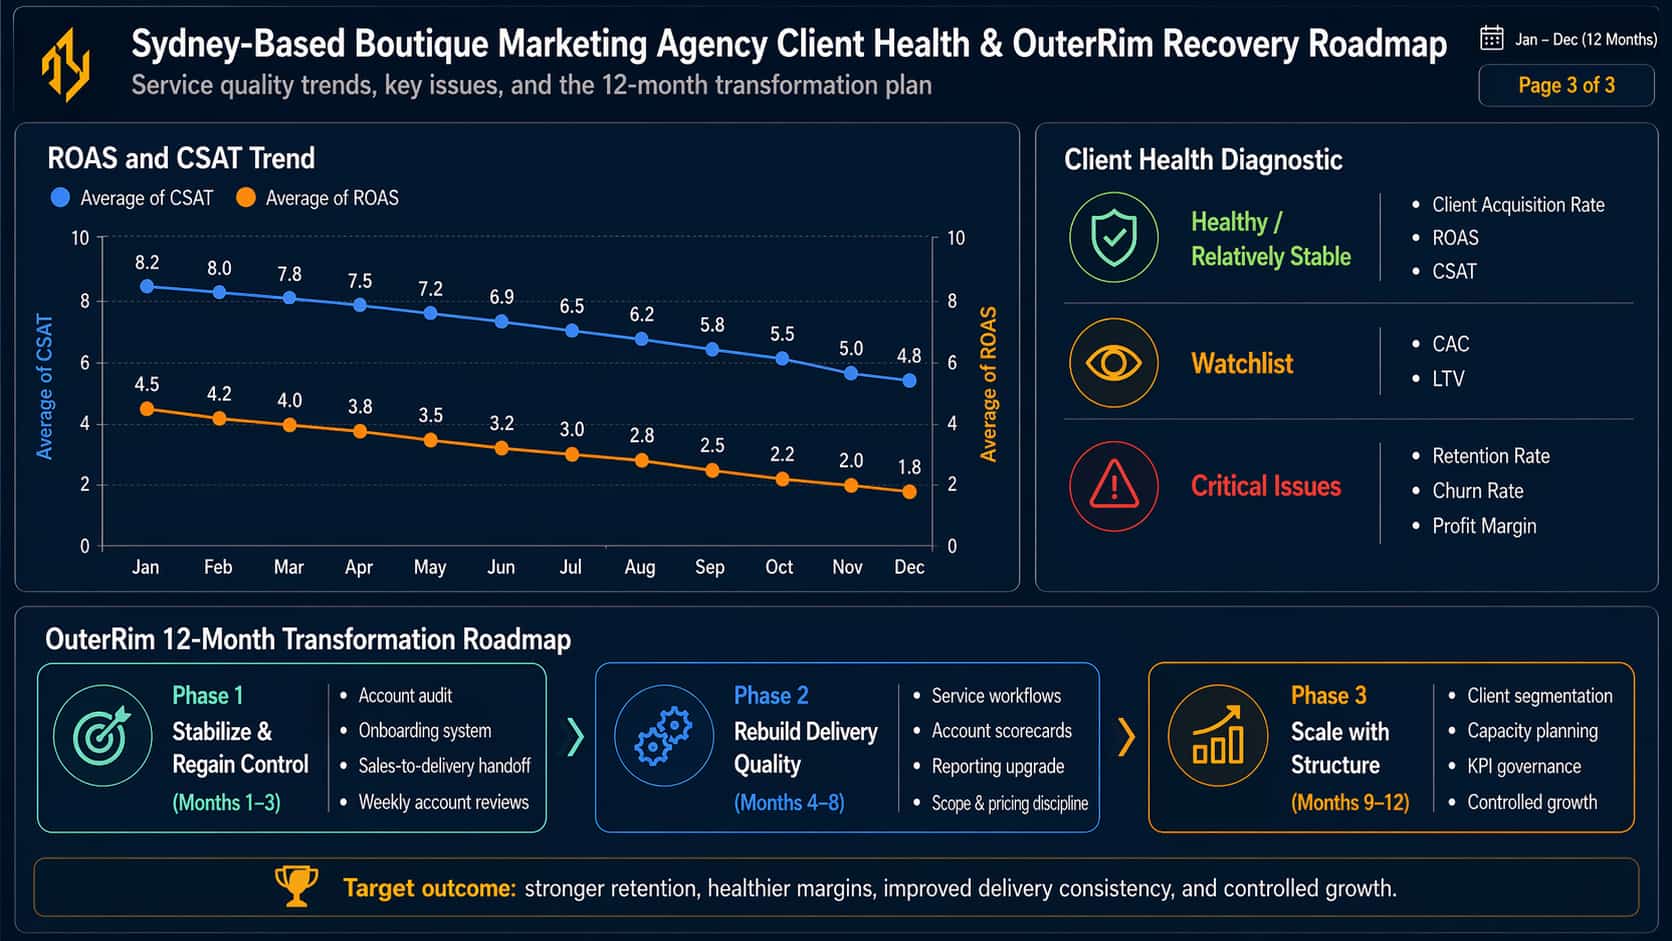
The third dashboard page connects client health with the recovery plan.
The ROAS and CSAT trend shows service quality and client outcomes weakening throughout the year. CSAT declines from 8.2 to 4.8, while ROAS declines from 4.5 to 1.8. When satisfaction and return on ad spend decline together, the problem is rarely only a campaign issue.
It usually reflects a wider service delivery problem.
The client’s health diagnostic supports that interpretation. Client acquisition rate, ROAS, and CSAT are shown as healthy or relatively stable areas, but CAC and LTV remain on the watchlist. Retention rate, churn rate, and profit margin are marked as critical issues.
The recovery roadmap is the strongest strategic element on this page.
Phase 1 focuses on stabilizing and regaining control across Months 1–3. This includes account audits, onboarding systems, sales-to-delivery handoff, and weekly account reviews.
Phase 2 focuses on rebuilding delivery quality across Months 4–8. This includes service workflows, account scorecards, reporting upgrades, and scope and pricing discipline.
Phase 3 focuses on scaling with structure across Months 9–12. This includes client segmentation, capacity planning, KPI governance, and controlled growth.
This page clearly positions the solution as operational transformation, not cosmetic reporting.
Root Cause Assessment
Underlying Operating Issues
| The dashboard points to five likely root causes |
| The first is a weak sales-to-delivery handoff. When expectations set during sales are not translated clearly into fulfillment, delivery teams start with an incomplete context. This creates rework, confusion, and client dissatisfaction. |
| The second is chaotic onboarding. Without a structured onboarding process, clients may begin engagements without clear goals, timelines, ownership, or success metrics. |
| The third is templated delivery without controlled customization. Many boutique agencies try to scale using repeatable delivery systems, but the system becomes weak when it removes too much client-specific strategy. |
| The fourth is reactive account management. Falling CSAT, rising churn, and declining retention suggest that client issues may have been identified too late. This is why improving Customer Experience and Operating Model discipline together matters; client satisfaction cannot be fixed only through better communication if the underlying delivery system remains inconsistent. |
| The fifth is limited leadership visibility. Without weekly account health reviews, capacity tracking, scope monitoring, and KPI governance, problems can grow quietly until they show up in revenue and churn. This is where stronger operational structuring becomes essential, because the agency needs repeatable systems for onboarding, account management, delivery visibility, and leadership review. |
The dashboard points to structural operating gaps behind declining retention, rising churn, and weaker client performance.
12-Month OuterRim Recovery Roadmap Assessment
The recovery roadmap should not focus on aggressive growth in the beginning. The agency needs control before scale in 3 distinct stages:
Phase 1: Months 1–3 — Stabilize and Regain Control
OuterRim would begin with an account and delivery audit.
Each client account should be reviewed for profitability, satisfaction risk, scope creep, reporting quality, renewal likelihood, and delivery complexity. Accounts should then be segmented into healthy, at-risk, and critical categories.
The onboarding process should also be rebuilt. Every client should have a structured intake process, kickoff agenda, role assignment, KPI definition, scope confirmation, and 30-day success plan.
The sales-to-delivery handoff should become mandatory. No account should enter fulfillment without a documented success brief, client goals, offer context, delivery scope, reporting rhythm, and ownership map.
By the end of Month 3, the agency should have better visibility, lower operational confusion, and clearer account ownership
Phase 2: Months 4–8 — Rebuild Delivery Quality and Account Performance
Once the business is stabilized, the focus should shift to delivery quality.
OuterRim would help create repeatable workflows for campaign launch, approvals, reporting, issue escalation, and renewal preparation. The goal is not robotic delivery. The goal is consistent delivery with enough structure to protect quality.
Account scorecards should also be introduced. Each client should be tracked by performance trend, satisfaction trend, responsiveness, profitability, renewal risk, and upsell potential.
Reporting should be upgraded from activity updates to decision-grade performance communication. Clients need to understand what happened, why it happened, what is being done, and what it means for future performance.
This phase should also include pricing and scope discipline. Low-margin accounts, unclear deliverables, and chronic over-servicing should be identified and corrected.
By the end of Month 8, the agency should have stronger account stability, better delivery consistency, improved client communication, and healthier unit economics.
Phase 3: Months 9–12 — Scale with Structure and Margin Discipline
The final phase should focus on controlled growth.
OuterRim would help leadership segment accounts by profitability, complexity, retention potential, and strategic value. This allows the agency to see which client profiles should be scaled, standardized, repriced, or exited.
Capacity planning should become part of the operating rhythm. Hiring and workload decisions should be tied to utilization, profitability, account complexity, and delivery stability.
A monthly KPI governance cadence should also be formalized. Revenue, profit margin, churn, retention, CAC, LTV, ROAS, CSAT, and client health should become standing leadership review items.
By the end of Month 12, the agency should be positioned to grow from a healthier base: better retention, stronger margins, cleaner delivery systems, and more controlled expansion.
Final Takeaway
This Sydney-Based Boutique Marketing Agency KPI Dashboard Case Study shows why agencies need more than activity reporting.
The dashboard reveals a business that was still generating revenue but losing performance quality underneath. Retention declined, churn increased, LTV weakened, CAC rose, margins compressed, and client satisfaction fell.
The core issue was not a lack of effort. It was a lack of operating structure.
With a stronger KPI dashboard, better reporting systems, and a 12-month operational recovery roadmap, leadership can move from reactive firefighting to controlled performance management.
Ready to Scale by Building Stronger Performance Visibility?
A growing agency does not lose control overnight. The warning signs usually appear first in retention, churn, margin pressure, client satisfaction, delivery inconsistency, and leadership reporting gaps.
OuterRim Ops & Analytics helps growth-stage agencies and SMBs build the systems behind stronger performance — combining KPI Dashboards, Reporting Systems, Operational Structuring, Client Health Tracking, Service Execution Visibility, Financial Visibility, Forecasting, and Intelligent Analytics-Driven Management Routines into a clearer operating foundation.
Schedule a meeting with OuterRim Ops & Analytics to explore how your agency can improve retention, protect margins, strengthen client delivery, and build a more scalable operating system.