Melbourne-Based Marketing Agency KPI Dashboard Case Study: 3 Strategic Performance Insights | OuterRim Ops & Analytics
A growing marketing agency can look busy while still losing visibility over the numbers that matter most. Campaigns may be running. Clients may still be active. The team may still be delivering work every week. But without a structured KPI reporting system, leadership can struggle to see whether the business is becoming more efficient, more profitable, or harder to control.
This Melbourne-Based Marketing Agency KPI Dashboard Case Study shows how KPI dashboards can help agency leadership move from scattered reporting to clearer visibility into performance. The dashboard reviews executive KPI performance, business outcome trends, and employee-level productivity signals across a 12-month operating view.
For OuterRim Ops & Analytics, the objective is not just to present charts. The objective is to show how KPI dashboards, reporting systems, and analytics can help growth-stage agencies diagnose performance gaps before they become deeper operational problems
Confidentiality & Source Note
The Melbourne-Based Marketing Agency KPI Dashboard Case Study is anonymized and does not disclose any confidential client information.
The company is presented as a Melbourne-based marketing agency for business analysis and benchmarking purposes. The analysis is based on publicly available company-related signals, market context, dashboard interpretation, KPI movement, and realistic business performance assumptions benchmarked against comparable agency operating scenarios.
Identifying details, client records, internal documents, private financials, and commercially sensitive information have been intentionally excluded. The purpose of this case study is to demonstrate how a structured marketing agency KPI dashboard can help leadership identify performance risks, improve visibility, and make better operating decisions.
Executive Summary
This Melbourne-Based Marketing Agency KPI Dashboard Case Study shows a business with recoverable strengths but clear performance gaps.
The agency’s average client acquisition cost is within target, which is positive. However, several important averages sit below target, including revenue growth, client retention, net profit margin, cash flow stability, customer satisfaction, and employee utilization.
That combination matters.
It suggests the agency is not facing a complete commercial breakdown. The acquisition engine is still manageable on average. But the business needs stronger operating discipline, better KPI ownership, and a more consistent management rhythm.
The three dashboard pages tell the story in sequence. Page 1 provides the executive KPI performance overview: page 2 diagnoses business outcomes and commercial pressure. Page 3 connects performance issues to employee utilization, turnover, and delivery consistency.
Together, these dashboards create a clear performance control layer for the leadership.
Dashboard Page 1: Melbourne-Based Marketing Agency Key KPI Performance
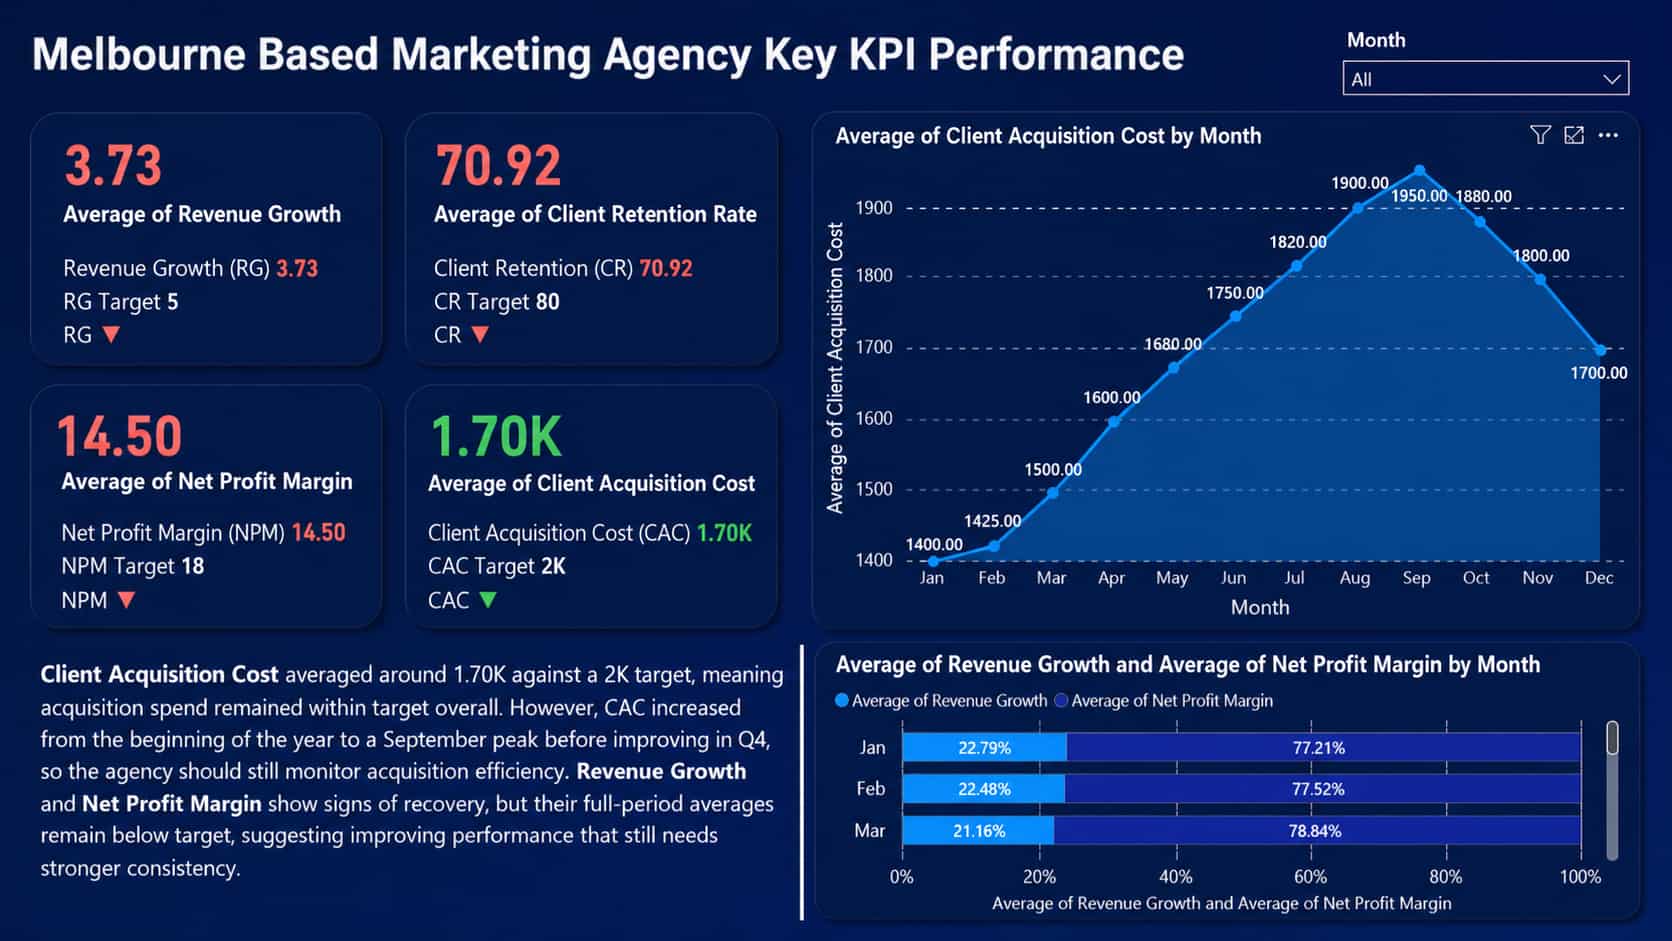
The first dashboard page from the Melbourne-Based Marketing Agency KPI Dashboard Case Study acts as the executive KPI performance overview.
At the headline level, client acquisition cost averaged 1.70K against a target of 2K. Since a lower CAC is better, this is one of the strongest signals in the dashboard. It shows that the agency is still acquiring clients within its acceptable cost range on average.
However, the surrounding KPI cards show pressure.
Revenue growth averaged 3.73 against a target of 5. Client retention rate averaged 70.92 against a target of 80. Net profit margin averaged 14.50 against a target of 18.
This means the agency’s acquisition cost is not the only issue leadership should review. The bigger issue is whether acquisition activity is converting into stronger retention, revenue growth, and profitability.
Dashboard Page 2: Melbourne-Based Marketing Agency Business Performance Outcomes
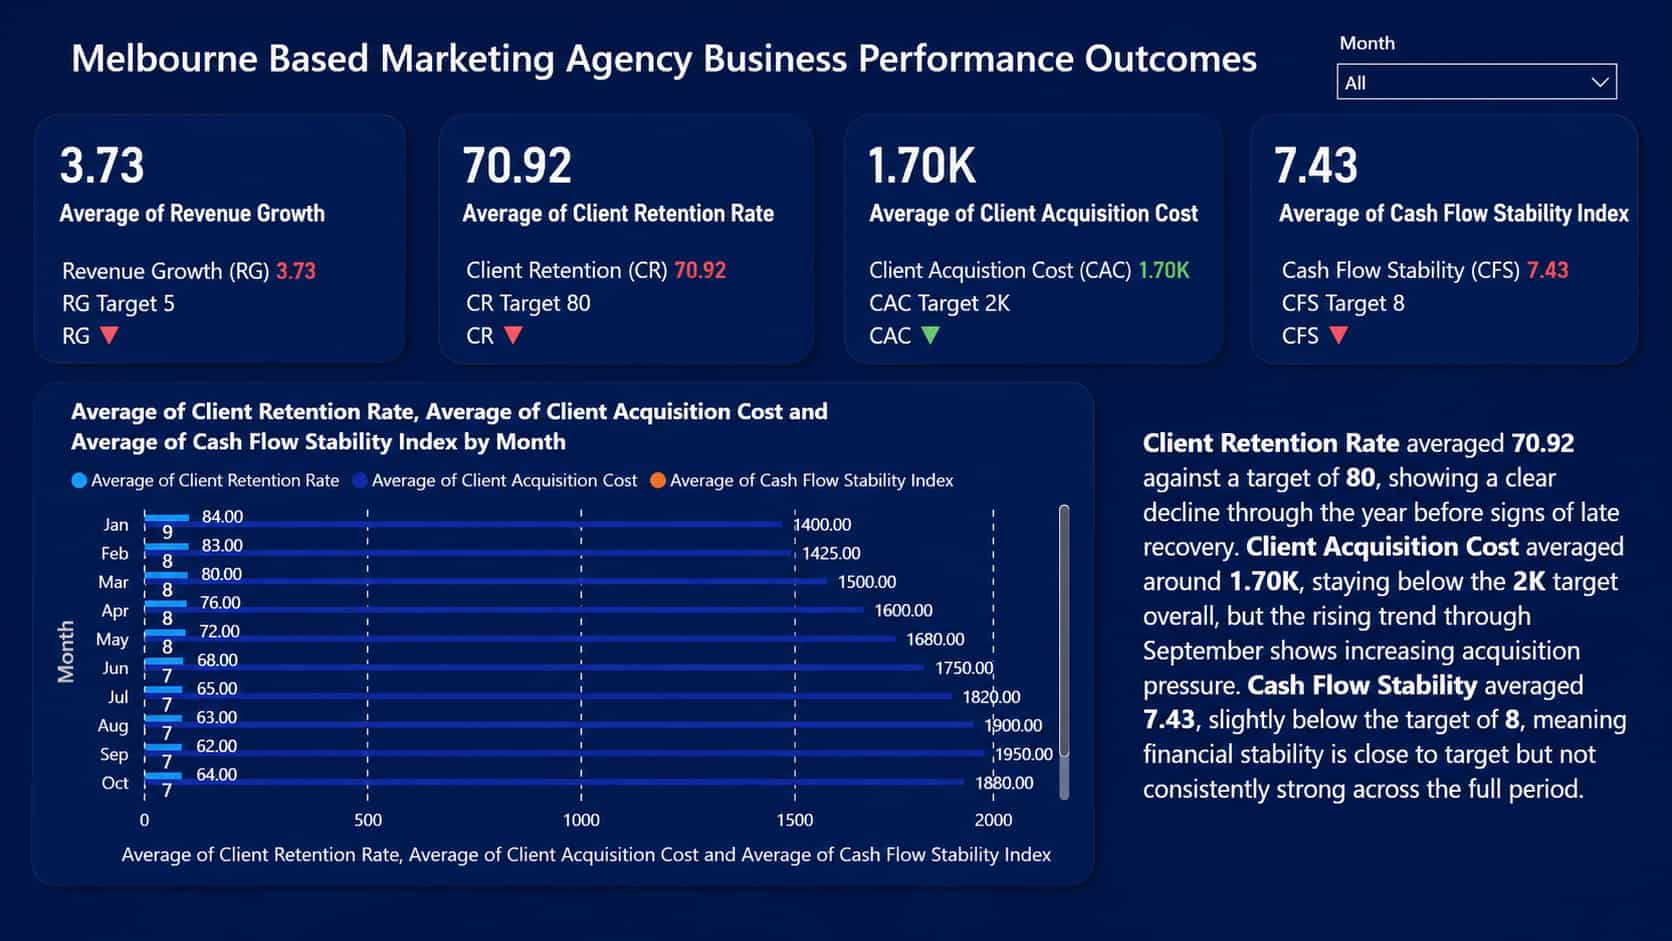
The second dashboard page from the Melbourne-Based Marketing Agency KPI Dashboard Case Study moves from executive visibility into business performance diagnosis.
Client retention rate averaged 70.92 against a target of 80. That is a meaningful gap. In an agency business, retention is not just a client service metric. It affects revenue predictability, delivery planning, staffing decisions, and the level of new business required to maintain growth.
The dashboard shows retention declining through the year before signs of late recovery. That recovery is useful, but the full-period average still indicates that retention discipline needs improvement.
Client acquisition cost averaged around 1.70K, staying below the 2K target overall. This is positive, but the rising trend through September shows that acquisition efficiency still needs monitoring.
Cash flow stability averaged 7.43 against a target of 8. This is close to the target but still underperforming. That may indicate timing issues, inconsistent collections, uneven monthly revenue, or weaker operating rhythm.
This page matters because it connects commercial and financial outcomes.
An agency can control CAC and still struggle if retention weakens. It can generate revenue activity and still experience cash flow pressure. It can look commercially active while becoming less predictable underneath.
That is where a business performance dashboard becomes valuable. It helps leadership see how retention, acquisition cost, and cash flow stability interact instead of treating them as separate reporting items.
For additional context, businesses often compare Customer Acquisition Cost and Lifetime Value Economics when assessing whether growth is becoming more or less efficient. This is why CAC should be reviewed alongside retention, margin, and cash flow rather than in isolation.
Dashboard Page 3: Melbourne-Based Marketing Agency Employee Performance Analysis
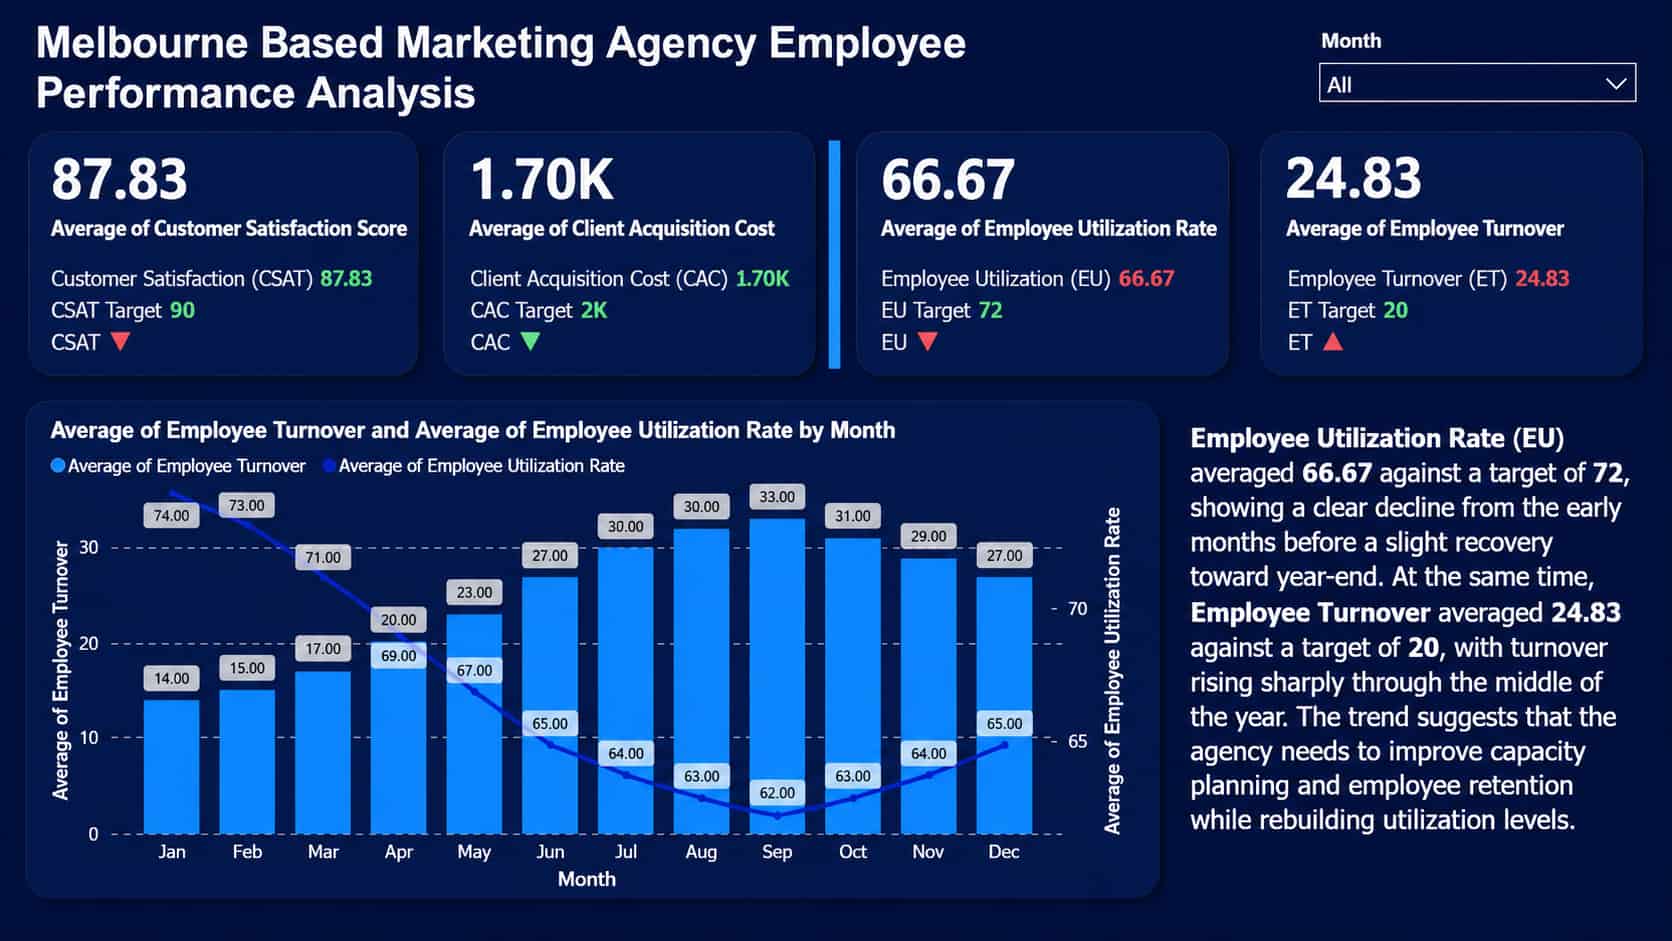
The third dashboard page connects business performance with employee productivity and delivery execution.
Customer satisfaction averaged 87.83 against a target of 90. Employee utilization averaged 66.67 against a target of 72. Employee turnover averaged 24.83 against a target of 20.
These numbers suggest that the agency has a workforce performance issue that leadership should not ignore.
The utilization trend is especially important. Employee utilization starts higher in the early months, declines through the middle of the year, and only slightly recovers toward year-end. This may point to uneven workload allocation, weaker project planning, unclear ownership, underused capacity, or delivery bottlenecks.
Employee turnover also rises in the middle of the year. That creates a second layer of operating risk. When turnover rises while utilization falls, the agency may lose consistency in client delivery, account continuity, and internal execution quality.
For a marketing agency, this can affect campaign delivery, client reporting, turnaround time, team morale, and service quality.
This is why Customer Experience and Operating Model disciplines should be reviewed together. If employee utilization, turnover, and delivery consistency are not managed properly, client satisfaction can weaken even when the agency is still commercially active.
That makes the dashboard useful as an accountability tool, not just a reporting asset.
Key Business Issues Identified
This Melbourne-Based Marketing Agency KPI Dashboard Case Study reveals five main business issues.
First, revenue growth and net profit margin are below target. This suggests the agency needs better control over how commercial activity converts into financial performance.
Second, client retention is below target. This increases pressure on acquisition because the agency must replace more revenue to maintain growth.
Third, CAC is within target on average, but the rising trend through September shows that acquisition pressure needs to be monitored.
Fourth, cash flow stability is close to the target but still underperforming. This may indicate inconsistent collections, uneven revenue timing, or weaker financial rhythm.
Fifth, employee utilization and turnover show delivery-system pressure. This is not only an HR issue. It affects client outcomes, profitability, and management control.
What the Dashboard Reveals About Agency Performance
The dashboard shows a business that still has room to recover.
The agency is not losing control across every metric. CAC remains within target on average, and some late-year recovery appears in key areas. That means the business has a workable foundation.
But the dashboard also shows that the agency needs a stronger operating structure.
The issue is not one isolated KPI. It is the relationship between KPIs. Revenue growth, retention, net profit margin, cash flow stability, utilization, and turnover are all connected.
If retention weakens, the agency needs more acquisition. If CAC rises, margins face pressure. If utilization falls, delivery efficiency suffers. If turnover rises, client continuity and service quality can weaken.
This is why leadership needs a connected KPI reporting system.
A properly interpreted dashboard helps the agency move from scattered reporting to structured performance control. It gives leadership a clearer view of what is improving, what is drifting, and where action is needed.
Recommended 12-Month Operational and Analytics Roadmap
The dashboard should not be treated as a one-time reporting exercise.
For this Melbourne-based agency, the stronger approach is to use the dashboard as the foundation for a 12-month performance improvement roadmap. OuterRim Ops & Analytics would break the work into three practical phases: visibility, control, and scalable performance management.
Phase 1: Months 1–3 — KPI Visibility, Reporting Structure, and Performance Diagnosis
The first three months should focus on building a reliable performance visibility layer.
OuterRim would review the agency’s current reporting process, validate KPI definitions, and confirm dashboard logic. This includes revenue growth, client retention, client acquisition cost, net profit margin, cash flow stability, customer satisfaction, employee utilization, and employee turnover.
In Month 1, the focus would be on data review, KPI validation, dashboard quality checks, and reporting gap identification.
In Month 2, the dashboard structure would be refined into executive, business outcome, and employee performance views.
In Month 3, leadership would begin using the dashboards in structured KPI review meetings, turning reporting into a management rhythm.
By the end of Phase 1, the agency should have clearer KPI ownership, cleaner reporting logic, and stronger visibility into underperforming areas.
Phase 2: Months 4–8 — Operational Improvement and Performance Control
Months 4 to 8 should focus on improving the business areas highlighted by the dashboard.
For client acquisition cost, OuterRim would help review lead sources, campaign efficiency, conversion quality, and acquisition spend patterns. For retention, the focus would shift to account management, client communication, service quality, and client health tracking.
For employee performance, the work would focus on workload allocation, utilization trends, delivery ownership, turnover pressure, and productivity bottlenecks.
In Months 4 and 5, the priority would be client retention, CAC movement, and revenue performance diagnosis.
In Months 6 and 7, the focus would shift toward delivery operations, employee utilization, workload balance, and team accountability.
In Month 8, these improvements would be consolidated into a structured operating rhythm with recurring KPI reviews, management check-ins, and performance action plans.
By the end of Phase 2, the agency should have stronger control over commercial efficiency, delivery visibility, employee productivity, and performance accountability.
Phase 3: Months 9–12 — Forecasting, Early Warning Systems, and Scalable Performance Management
The final four months should make the system more forward-looking.
Once KPI tracking and operating discipline are in place, OuterRim would help leadership move from retrospective reporting to predictive performance management.
This may include CAC forecasting, retention risk tracking, cash flow trend monitoring, employee utilization alerts, and early warning indicators for delivery pressure.
In Month 9, OuterRim would review historical KPI patterns and identify which indicators are most useful for forecasting.
In Month 10, the agency would begin building early warning views for acquisition cost, retention, cash flow, and employee utilization.
In Month 11, these insights would be integrated into monthly leadership reviews and planning discussions.
In Month 12, OuterRim would finalize the performance management system, document the operating cadence, and prepare the agency for ongoing dashboard-led decision-making.
By the end of Phase 3, the agency should have a more scalable operating system that supports clearer decisions, stronger accountability, and better control over growth.
12-Month Recovery Roadmap Summary
| Timeline | Focus Area | Main Objective |
| Months 1–3 | KPI visibility and diagnosis | Build a reliable reporting foundation and identify performance gaps |
| Months 4–8 | Operational improvement and control | Improve retention, CAC management, delivery visibility, utilization, and accountability |
| Months 9–12 | Forecasting and scalable management | Add early warning indicators and make the dashboard part of leadership decision-making |
| After 12 months | Performance Evaluation & Next-Cycle Planning | Evaluate KPI improvements, compare performance against targets, identify remaining gaps, and define the next 6–12 month operating priorities |
Final Takeaway
This Melbourne-Based Marketing Agency KPI Dashboard Case Study shows why dashboards should not be treated as visual reporting assets alone.
When built and interpreted properly, a marketing agency KPI dashboard becomes a business control layer. It helps leadership understand where performance is strong, where the business is drifting below target, and where management should intervene first.
In this case, the agency still has a recoverable foundation. But the dashboard reveals clear gaps in revenue growth, retention, margin, cash flow stability, utilization, and turnover.
That is exactly where Structured Reporting Systems, KPI Dashboards, and Analytics-Driven Operations create value.
Ready to Improve KPI Visibility and Business Control?
If your agency or service business is growing but becoming harder to manage, OuterRim Ops & Analytics can help you build the visibility layer behind better decisions.
We help growth-stage SMBs design KPI dashboards, reporting systems, operational structures, delivery visibility, financial visibility, and analytics-driven performance controls.
Schedule a meeting with OuterRim Ops & Analytics to explore how your business can improve KPI visibility, delivery control, financial clarity, and operating performance