Seattle-Based Marketing Agency KPI Dashboard Case Study: 3 Powerful Growth Insights | OuterRim Ops & Analytics
Confidentiality & Source Note
This case study, titled Seattle-Based Marketing Agency KPI Dashboard Case Study, presents the business as a Seattle-based marketing agency without naming the organization directly. The company name and identifying details are intentionally withheld to protect confidentiality while preserving the business context needed for diagnostic review. The analysis is based on a 12-month KPI dashboard and supporting performance materials presented under a confidentiality-protected business framework.
Executive Summary
This Seattle-Based Marketing Agency KPI Dashboard Case Study shows how a KPI dashboard can reveal whether a business is becoming more scalable, more profitable, and more controllable over time. In this case, the dashboard tells a commercially important story. At a surface level, the agency still shows healthy retention, relatively stable delivery quality, and mild growth in average revenue per client. But once the trends are viewed together, the deeper picture becomes clear: utilization is falling, gross margin is compressing, customer acquisition cost is rising, conversion is softening, and the relationship between customer value and acquisition cost is becoming less attractive month by month.
That combination matters because it suggests the agency is not facing a dramatic collapse in service quality or demand. Instead, it is drifting into a less efficient operating model. This is exactly the stage where leadership still has room to intervene before the problem becomes structural.
From OuterRim Ops & Analytics’ perspective, this is best understood as an operational discipline issue, not a demand issue. The business still has commercial strength. What it needs is sharper visibility into delivery efficiency, better control over customer acquisition economics, and a more structured operating rhythm that protects margin while supporting growth.
The three dashboard pages in this case study tell that story in sequence: first the executive KPI view, then the commercial and efficiency analysis, and finally the client-health interpretation and 12-month improvement roadmap.
Seattle-Based Marketing Agency KPI Dashboard Case Study Page 1: Executive KPI Overview
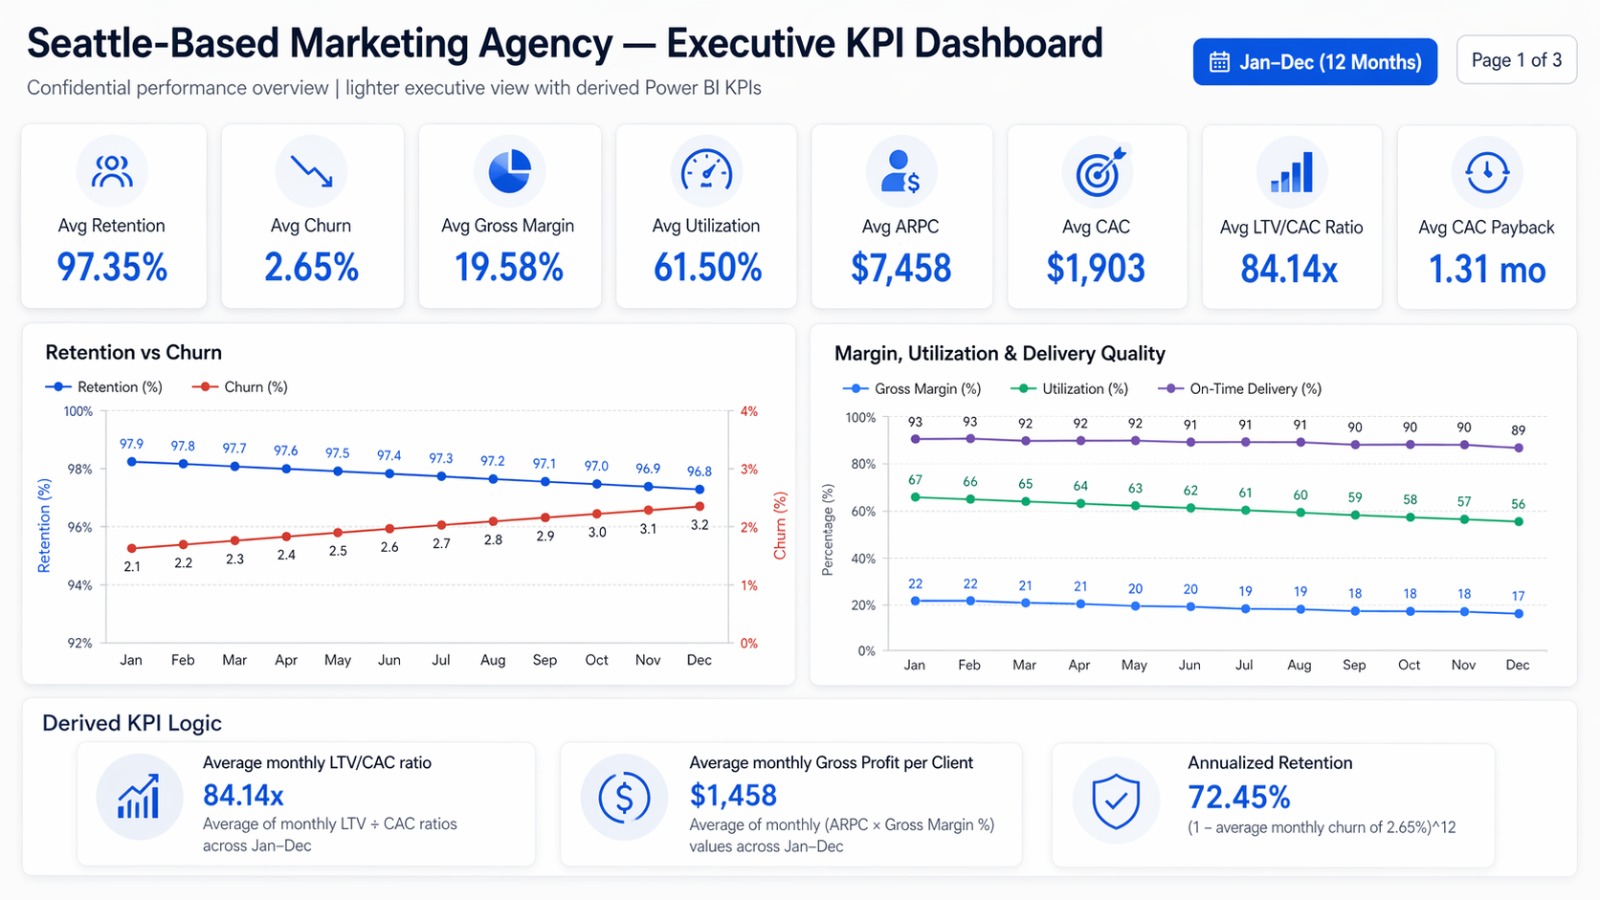
The first dashboard page provides the executive view. It summarizes the business through the metrics leadership should monitor first: retention, churn, gross margin, utilization, average revenue per client, customer acquisition cost, LTV/CAC ratio, and CAC payback.
At the headline level, the business still appears stable enough to avoid panic. Average retention sits at 97.35%, while average churn remains relatively low at 2.65%. Those are healthy signals, and they explain why this is still a recoverable operating situation rather than a late-stage decline. Average ARPC stands at $7,458, which supports the case that revenue quality has not collapsed. The average LTV/CAC ratio remains high at 84.14x, and average CAC payback is still only 1.31 months.
But the trend lines tell the more important story.
Retention declines gradually from 97.9% in January to 96.8% in December, while churn rises from 2.1% to 3.2%. Those changes may look small in isolation, but they matter because they move in the wrong direction across the full year.
More importantly, the margin and utilization lines show consistent weakening. Gross margin falls from 22% to 17%, while utilization drops from 67% to 56%. On-time delivery also softens from 93% to 89%. That tells leadership something important: the agency is still functioning, but it is converting operational effort into commercial output less efficiently than before.
Seattle-Based Marketing Agency KPI Dashboard Case Study Page 2: Commercial & Efficiency Analysis
In this Seattle-Based Marketing Agency KPI Dashboard Case Study, the second dashboard page moves from surface-level reporting into commercial and efficiency diagnosis.
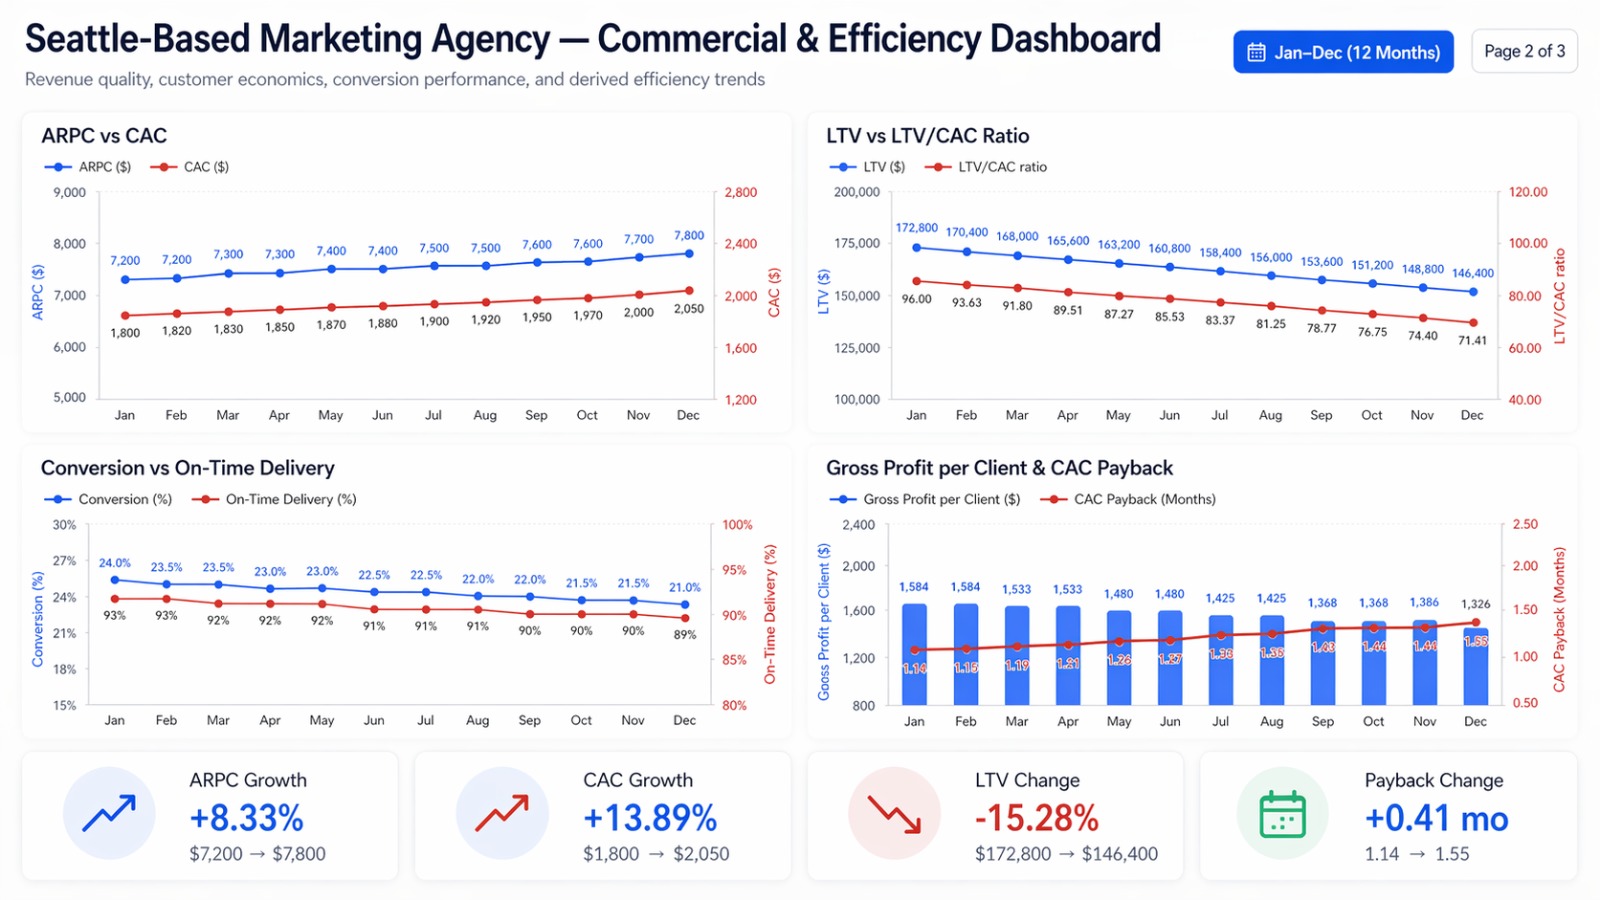
The ARPC vs CAC trend immediately highlights an imbalance. ARPC rises from $7,200 to $7,800, which is positive. But CAC rises from $1,800 to $2,050 over the same period. That means the agency is improving revenue per account, but not quickly enough to offset growing acquisition pressure. The year-end comparison cards make this even clearer: ARPC grows by 8.33%, while CAC grows by 13.89%.
The LTV vs LTV/CAC ratio chart sharpens the concern. LTV declines from $172,800 in January to $146,400 in December, a drop of 15.28%. At the same time, the LTV/CAC ratio compresses from 96.00x to 71.41x. Even though the ratio remains strong in absolute terms, the direction matters. A falling ratio means the economics of new growth are becoming less attractive, even before that deterioration fully hits topline outcomes.
For broader context on customer acquisition cost and lifetime value economics, businesses often benchmark against practical CLV and LTV:CAC frameworks from HubSpot.
The Conversion vs On-Time Delivery chart shows the link between operations and commercial performance. Conversion falls from 24.0% to 21.0%, while on-time delivery slips from 93% to 89%. Neither line suggests dramatic failure, but together they show softening consistency. In agency businesses, that kind of decline often points to friction in delivery rhythm, client communication, handoffs, reporting clarity, or ownership control.
The fourth chart brings the case together. Gross profit per client declines from $1,584 to $1,326, while CAC payback increases from 1.14 months to 1.55 months. This is a meaningful deterioration in operating efficiency. The agency is still viable, but it is taking longer to recover acquisition costs while generating less profit per client.
Taken together, Page 2 shows a business that is not in freefall, but is becoming commercially less efficient in ways that will eventually affect margin, control, and scalability if left unmanaged.
Seattle-Based Marketing Agency KPI Dashboard Case Study Page 3: Diagnostic Summary & 12-Month Roadmap
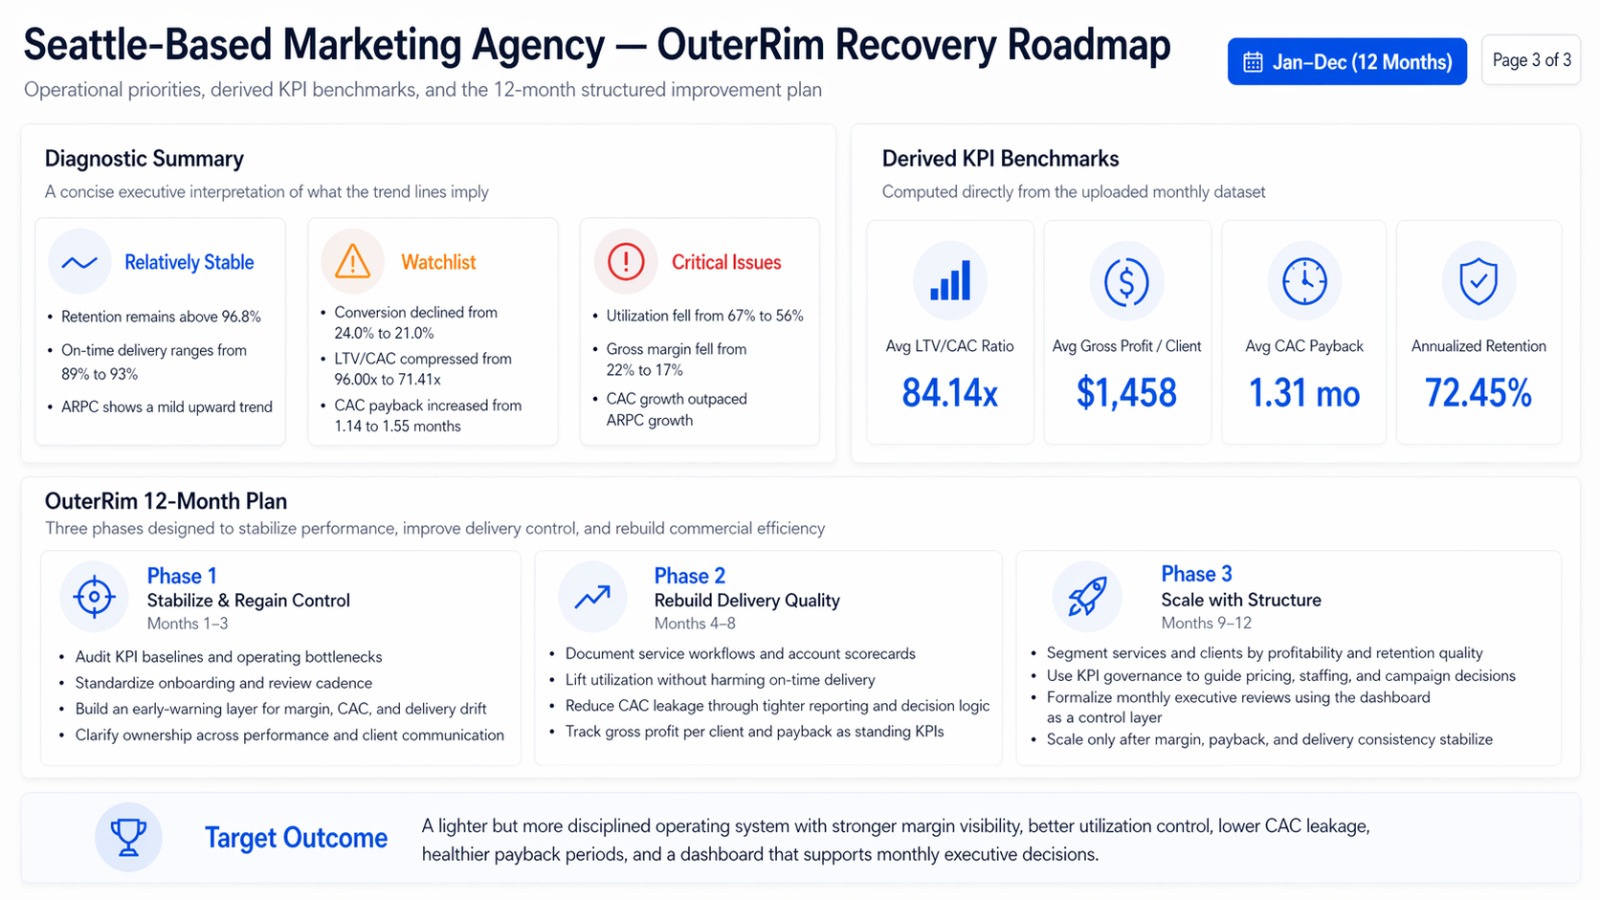
The third section of this Seattle-Based Marketing Agency KPI Dashboard Case Study translates performance signals into a practical 12-month operating roadmap.
The “Relatively Stable” block is fair: retention remains above 96.8%, on-time delivery still ranges between 89% and 93%, and ARPC maintains a mild upward trend. These are real strengths, and they explain why the agency still has room to correct course.
The “Watchlist” section is equally important. Conversion has declined from 24.0% to 21.0%, the LTV/CAC ratio has compressed from 96.00x to 71.41x, and CAC payback has increased from 1.14 to 1.55 months. These are not yet collapse-level indicators, but they show that the commercial engine is becoming less efficient.
The “Critical Issues” section identifies the real operating pressure points. Utilization falls from 67% to 56%, gross margin declines from 22% to 17%, and CAC growth outpaces ARPC growth. That is the core management problem.
From there, the roadmap becomes practical.
Phase 1: Stabilize & Regain Control (Months 1–3).
The first priority is tighter control. Leadership should audit KPI baselines, identify operating bottlenecks, standardize onboarding and review cadence, build an early-warning layer for margin, CAC, and delivery drift, and clarify ownership across client communication and performance management.
Phase 2: Rebuild Delivery Quality (Months 4–8).
Once control improves, the next step is to rebuild delivery consistency. This includes documenting service workflows, introducing account scorecards, improving utilization without harming on-time delivery, reducing CAC leakage through tighter reporting and decision logic, and tracking gross profit per client and payback as standing KPIs.
Phase 3: Scale with Structure (Months 9–12).
Only after stabilization should the agency push for structured scale. At this stage, services and clients should be segmented by profitability and retention quality, KPI governance should guide pricing and staffing decisions, and monthly executive reviews should use the dashboard as a genuine control layer.
The target outcome is not just better reporting. It is a lighter but more disciplined operating system with stronger margin visibility, better utilization control, lower CAC leakage, healthier payback periods, and a dashboard that supports monthly executive decisions.
Root Cause Interpretation
From an operations and analytics standpoint, the likely causes of decline are structural rather than cosmetic.
First, the agency appears to be carrying margin leakage through falling utilization. That usually signals workflow inefficiency, project-loading imbalance, over-servicing, or weak prioritization.
Second, customer acquisition efficiency is softening. CAC is rising faster than ARPC, which means the commercial system is spending more for each marginal unit of value created.
Third, conversion and delivery quality are drifting together. The agency is still delivering reasonably well, but not strongly enough to offset weakening economics elsewhere. In practice, this often points to issues in handoffs, reporting cadence, accountability, and management visibility rather than one isolated marketing problem.
Final Takeaway
The Seattle-Based Marketing Agency KPI Dashboard Case Study shows why a KPI dashboard should not be treated as a visual reporting asset alone. When built and interpreted correctly, it becomes a diagnostic layer for the business itself. In this case, the dashboard reveals a marketing agency that still has commercial strength, but is losing efficiency in ways that will eventually pressure profitability, delivery control, and scalable growth if left unchecked.
That is where OuterRim Ops & Analytics creates impact. We do not just build dashboards. We build the operating structure behind them: KPI logic, reporting cadence, visibility systems, and management controls designed to improve margin, efficiency, and commercial clarity.
Ready to Improve Margin, Visibility, and Control?
As this Seattle-Based Marketing Agency KPI Dashboard Case Study makes clear, operational efficiency must be protected before growth can scale cleanly.
If your agency or service business is generating revenue but feels less efficient than it should, OuterRim Ops & Analytics can help you turn scattered metrics into a structured operating system that supports better decisions.
From KPI dashboards and reporting systems to workflow discipline, operational visibility, and performance control, we help growth-stage businesses build with more clarity, control, and predictability.
Schedule a meeting with OuterRim Ops & Analytics to explore how your business can improve KPI Visibility, Delivery Control, and Operating Efficiency.